TABLEAU
What is it?
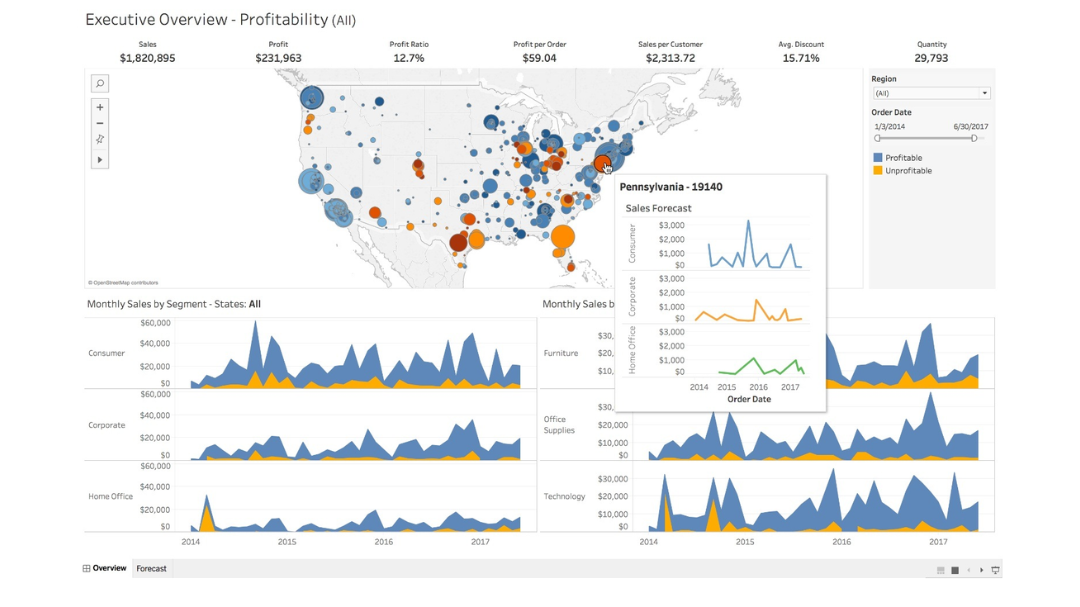
Tableau is a data analytics and visualization platform that helps users to visualisate, interpretate, and take action on their data more effectively.
- Data Visualization: Enables the bluid of interactive charts, tables, and dashboards to better interpretate large datasets.
- Real-Time Analysis: Allows real-time data analysis for quick and informed decision- making.
- Data Integration: Connects to a wide variety of data sources, including databases, spreadsheets, and cloud services.
- Ease of Use: Intuitive interface enables users to create complex visualizations without advanced programming knowledge.
- Collaboration: Facilitates teamwork by allowing secure and efficient sharing of reports and dashboards.
Getting Started with Tableau:
- 1.Download and Install Tableau.
- 2.Connect to a Data Source.
- 3.Explore and transform Your Data.
- 4.Create views.
- 5.Build a Dashboard.
- 6.Publish and Share
Previus Knowledge:
- Basic Data Concepts.
- Excel or Spreadsheet.
- Data views.
- Basic SQL.
- Data Analysis.
Key Features
- Intuitive Interface: Tableau enables drag-and-drop functionality for effortless data views.
- Tableau Desktop: The pricipal version for visual analysis, allowing data import and exploration without code.
- Tableau Cloud: A cloud-based platform that supports self-service analytics and adapts to business needs.
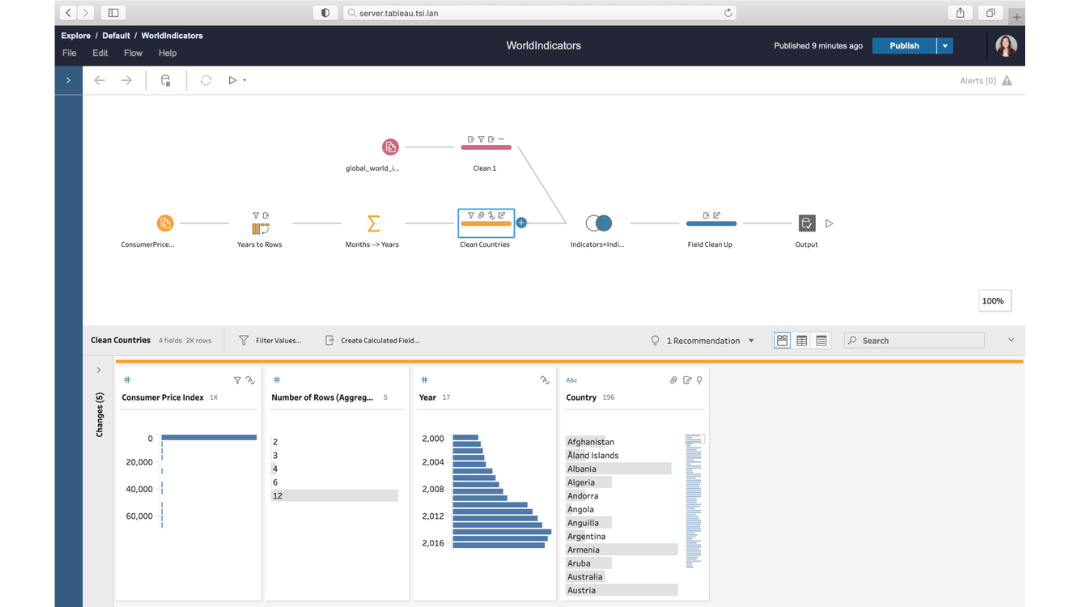
- Tableau Prep: Simplifies the data, cleaning and organization for streamlined analysis.
- Ease to Use: Designed for be accessibilited, even for non-technical users, enabling efficient report creation and data analysis.


Successful cases
Working with ARSA BI allowed us to optimize our data processes in an incredible way. Their focus on API development and data architecture improved our system integration and reduced response times by 40%. They are the ideal partner for companies looking for scalable and efficient solutions.
Alejandro GómezCTO
Thanks to ARSA BI, we implemented ETL and Data Warehousing processes that have given us access to key real-time information. This has enabled us to make data-driven strategic decisions, increasing our efficiency and profitability. Their team is highly professional and always willing to provide innovative solutions.
Mariana TorresGerente de Análisis de Datos
With ARSA BI, we were able to transform our data management and automate processes that were previously manual and prone to errors. Their BI project management and software development services allowed us to focus on growing our business while they took care of the technology. An exceptional team with an unmatched strategic approach.
Ricardo LópezCEO


